Laravel + OPcache Performance Benchmark

1. Introduction
Today, I ran a quick benchmark capturing a Laravel 5.8 application on PHP 7.2 with and without OPcache enabled.
The application is running on a 2GB/1CPU “t2.small EC2” instance.
I used
![]() as a HTTP Benchmark Tool.
as a HTTP Benchmark Tool. hey is a ApacheBench (ab) replacement and written in Go (golang).
Command used:
hey -c 50 -z 1m <url>

-c  Number of requests to run concurrently.
-z  Duration of application to send requests.
2. Result
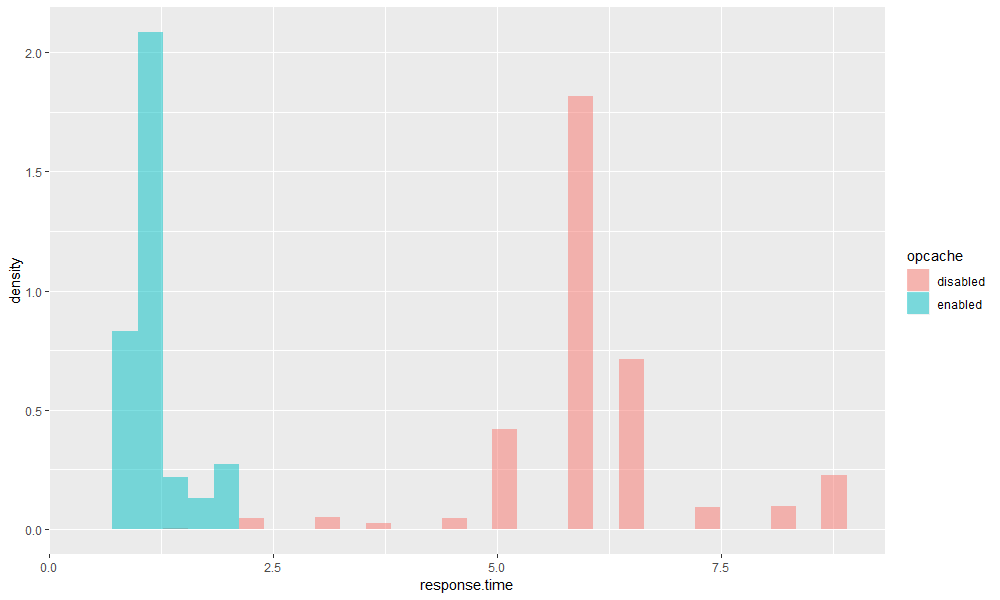
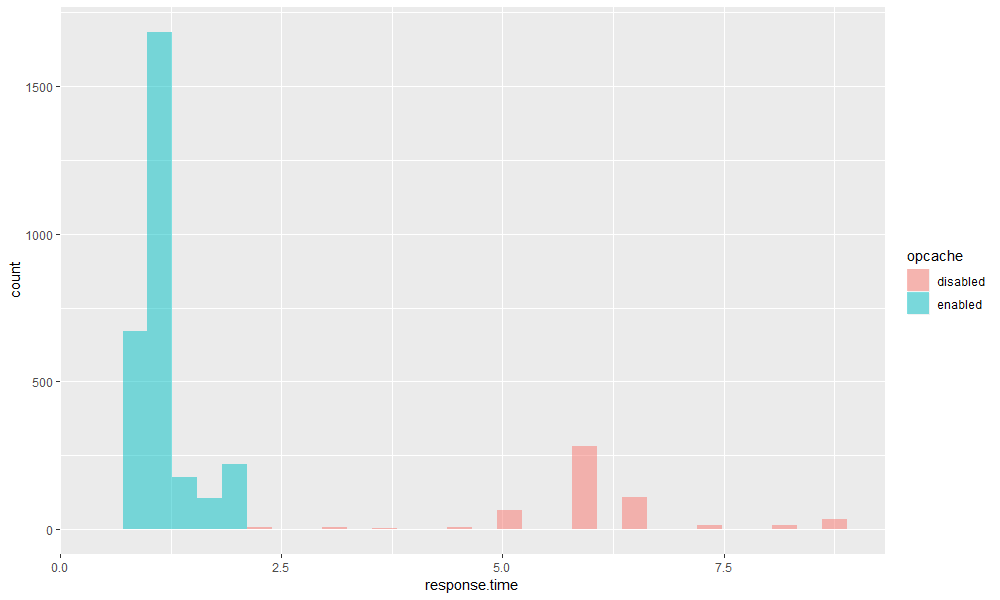
With OPcache the application is about ~5.5x faster
OPcache ENABLED:
  Average:      1.0649 secs
  Requests/sec: 46.4018
OPcache DISABLED:
  Average:      5.7209 secs
  Requests/sec: 8.4262
Density Histograms:
Count (#requests) Histograms:
3. OPcache configuration
[opcache]

opcache.enable=1
opcache.revalidate_freq=0
opcache.save_comments=1
opcache.fast_shutdown=1

opcache.validate_timestamps=0
opcache.max_accelerated_files=32531
opcache.memory_consumption=512
opcache.max_wasted_percentage=10
opcache.interned_strings_buffer=64
This configuration is only for documentation purposes. Do not use this configuration, unless you understand the values.
4. More Data
OPcache Enabled:
Summary:
  Total:        61.6141 secs
  Slowest:      2.0920 secs
  Fastest:      0.5845 secs
  Average:      1.0649 secs
  Requests/sec: 46.4018


Response time histogram:
  0.584 [1]     |
  0.735 [53]    |■■
  0.886 [617]   |■■■■■■■■■■■■■■■■■■■
  1.037 [1269]  |■■■■■■■■■■■■■■■■■■■■■■■■■■■■■■■■■■■■■■■■
  1.188 [415]   |■■■■■■■■■■■■■
  1.338 [144]   |■■■■■
  1.489 [34]    |■
  1.640 [34]    |■
  1.791 [71]    |■■
  1.941 [139]   |■■■■
  2.092 [82]    |■■■


Latency distribution:
  10% in 0.8153 secs
  25% in 0.8923 secs
  50% in 0.9725 secs
  75% in 1.0996 secs
  90% in 1.6723 secs
  95% in 1.8788 secs
  99% in 1.9911 secs

Details (average, fastest, slowest):
  DNS+dialup:   0.0154 secs, 0.5845 secs, 2.0920 secs
  DNS-lookup:   0.0001 secs, 0.0000 secs, 0.0073 secs
  req write:    0.0000 secs, 0.0000 secs, 0.0006 secs
  resp wait:    1.0471 secs, 0.1966 secs, 2.0915 secs
  resp read:    0.0024 secs, 0.0002 secs, 0.4318 secs

Status code distribution:
  [200] 2859 responses
OPcache Disabled:
Summary:
  Total:        64.7981 secs
  Slowest:      8.7746 secs
  Fastest:      1.5320 secs
  Average:      5.7209 secs
  Requests/sec: 8.4262


Response time histogram:
  1.532 [1]     |
  2.256 [7]     |■
  2.981 [8]     |■
  3.705 [4]     |■
  4.429 [7]     |■
  5.153 [65]    |■■■■■■■■■
  5.878 [280]   |■■■■■■■■■■■■■■■■■■■■■■■■■■■■■■■■■■■■■■■■
  6.602 [110]   |■■■■■■■■■■■■■■■■
  7.326 [14]    |■■
  8.050 [15]    |■■
  8.775 [35]    |■■■■■


Latency distribution:
  10% in 5.0113 secs
  25% in 5.3178 secs
  50% in 5.5981 secs
  75% in 6.0353 secs
  90% in 6.9217 secs
  95% in 8.2934 secs
  99% in 8.6869 secs

Details (average, fastest, slowest):
  DNS+dialup:   0.0950 secs, 1.5320 secs, 8.7746 secs
  DNS-lookup:   0.0006 secs, 0.0000 secs, 0.0073 secs
  req write:    0.0000 secs, 0.0000 secs, 0.0002 secs
  resp wait:    5.6233 secs, 0.5516 secs, 8.7738 secs
  resp read:    0.0026 secs, 0.0002 secs, 0.3580 secs

Status code distribution:
  [200] 546 responses
Read other posts